

Data Analytics: Expert Insights and Recommendations
Most businesses are drowning in data and starved of insight. Every point-of-sale terminal, website visit, support ticket, invoice, and marketing campaign throws off numbers, yet the majority of that information sits unused in disconnected systems that never talk to each other. Data analytics is the discipline of turning that raw exhaust into decisions you can actually act on, and getting it right is one of the highest-leverage investments a growing company can make.
The problem is that analytics is easy to do badly. It is entirely possible to spend a small fortune on tools and dashboards and still have leaders making gut calls because nobody trusts the numbers, or because the numbers answer questions nobody asked. Good analytics is not about having more charts. It is about asking sharper questions, building a foundation you can rely on, and delivering answers to the people who make decisions, in a form they will use.
This guide shares practical, hard-won insights on doing data analytics properly, from the plumbing that feeds your reports to the governance that keeps them trustworthy. Whether you are a Sydney retailer trying to understand your customers, a services firm chasing efficiency, or an operations manager buried in spreadsheets, these recommendations will help you build analytics that earn their keep.
What data analytics really means for a business
Data analytics is the process of examining data to find patterns, answer questions, and support decisions. In practice it spans a spectrum, from simply describing what happened, to explaining why, predicting what comes next, and recommending what to do about it. Most organisations live at the descriptive end without realising there is far more value further along the curve.
It helps to think of analytics in four maturing stages. Descriptive analytics tells you what happened: last month's revenue, this week's support volume, yesterday's conversion rate. Diagnostic analytics digs into why something happened, connecting a sales dip to a stockout or a website change. Predictive analytics uses historical patterns to forecast what is likely, such as which customers are about to churn. Prescriptive analytics goes one step further and recommends an action, like which inventory to reorder and when.
You do not need to reach the sophisticated end overnight. In fact, most businesses get enormous value simply by making descriptive and diagnostic analytics reliable, timely, and trusted. The mistake is chasing machine learning and predictive models before the basic numbers are even clean. A solid data management foundation is what makes every later stage possible.
Start with the questions, not the tools
The single most common analytics failure is buying a tool first and figuring out what to do with it later. This produces impressive-looking dashboards that answer no real question and gather dust within a month. The right sequence is the reverse: start with the decisions your business needs to make, then work backwards to the data and tools that support them.
Sit down with the people who actually run the business and ask what keeps them up at night. Which customers are most valuable? Where are we losing deals? What is our true cost to serve? Which marketing channel actually pays for itself? Each of these is a decision waiting for data, and each one implies specific metrics, specific sources, and a specific way of presenting the answer.
Define metrics that map to decisions
A useful metric changes what someone does. If a number goes up or down and nobody would act differently, it is a vanity metric and it is quietly costing you attention. Focus ruthlessly on measures tied to outcomes: customer acquisition cost, lifetime value, gross margin by product, average resolution time, repeat purchase rate. For each one, agree a single, documented definition so that everyone means the same thing when they say "active customer" or "monthly revenue." Ambiguous definitions are where trust in analytics goes to die.
Build a reliable data foundation
Analytics is only as good as the data feeding it, and this is where most of the real work lives. Before you can analyse anything, the relevant data has to be collected, cleaned, combined, and stored somewhere it can be queried. This pipeline is unglamorous but decisive: skimp here and every downstream chart inherits the flaws.
Collecting and integrating your sources
Typical businesses have data scattered across accounting software, a CRM, an e-commerce platform, email marketing tools, spreadsheets, and often a legacy system or two. The first job is to bring these together so they can be analysed as a whole rather than in isolated silos. This usually means building integrations that pull data from each source on a schedule, which is exactly the kind of work our API development and integration services handle. When systems can share data cleanly, the analytics almost builds itself.
Cleaning and modelling the data
Raw data is messy. The same customer appears three times under slightly different spellings, dates are formatted five ways, currencies are mixed, and half the phone numbers are missing. Data cleaning and transformation turns this into a consistent, reliable dataset. Alongside cleaning sits data modelling: structuring the information so relationships between customers, orders, products, and interactions are explicit and easy to query. Thoughtful database design and development at this stage saves you from slow, error-prone reports later.
Where the data lives
For anything beyond a handful of spreadsheets, you will want a central store, whether that is a data warehouse for structured reporting or a lighter-weight database for a smaller operation. The point of a warehouse is to separate your analytics workload from the systems that run day to day, so heavy queries never slow down your live sales or booking platform. For larger organisations juggling many systems, this consolidation often forms part of a broader enterprise software solution.
Choose the right analytics tools
Only once you know your questions and have a foundation to build on does the tool conversation make sense. The market is crowded, but tools generally fall into a few categories, and the right pick depends on your scale, your team's skills, and your budget rather than on which product is most fashionable.
- Spreadsheets remain genuinely useful for small datasets and quick analysis, and there is no shame in starting here. They become a liability only when they turn into a fragile web of linked files that one person understands and nobody can audit.
- Business intelligence platforms such as Power BI, Tableau, Looker, and similar tools are built for connecting to multiple sources, modelling data, and producing interactive dashboards. For most established businesses, this is the sweet spot.
- Web and product analytics tools track how people use your website or application, capturing behaviour that never touches your accounting or CRM systems.
- Custom analytics built into your own software makes sense when off-the-shelf tools cannot express your specific logic, or when analytics needs to live inside a product you sell.
A pragmatic recommendation: resist the urge to buy the most powerful platform on the market before you have outgrown a simpler one. Match the tool to the problem in front of you, and be prepared to graduate to something heavier as your needs mature. When your requirements are genuinely bespoke, embedding analytics into a purpose-built application through our software development team is often more effective than forcing a generic tool to do something it was never designed for.
Design dashboards people actually use
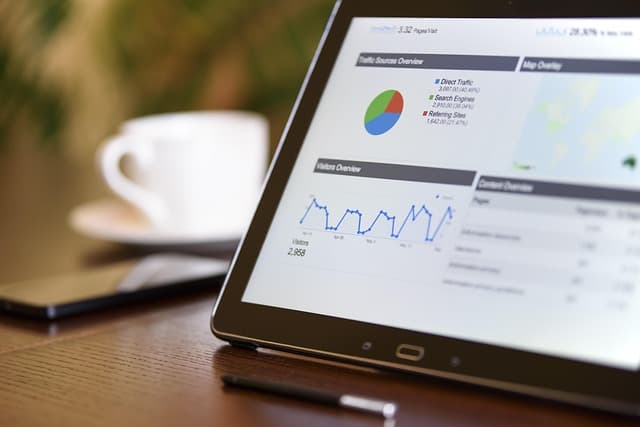
A dashboard is a communication tool, not a data dump. The most common sin in analytics is the "everything" dashboard: forty metrics crammed onto one screen in a rainbow of charts, so overwhelming that viewers glance at it once and never return. A great dashboard does the opposite, guiding the eye to what matters and making the next action obvious.
Principles for dashboards that work
- One audience, one purpose. A dashboard for the sales manager should not try to also serve the warehouse team and the finance director. Build focused views for each role rather than one screen that half-serves everyone.
- Lead with the answer. Put the two or three numbers that matter most at the top, large and unmissable, with supporting detail beneath for those who want to dig in.
- Show context, not just values. A revenue figure means little on its own. Compared to target, to last month, and to the same period last year, it tells a story.
- Choose the right chart. Trends over time suit line charts, comparisons suit bars, and composition suits stacked bars far better than pie charts. Match the visual to the question.
- Remove everything that does not earn its place. Every extra gridline, colour, and label competes for attention. Ruthless simplicity is what makes a dashboard readable at a glance.
The test of a good dashboard is simple: can someone who has never seen it understand the state of the business in under ten seconds, and know what to look at next? If not, it needs editing, not more charts.
Make analytics timely and accessible
Even perfect analysis is worthless if it arrives too late or lives somewhere nobody looks. Timeliness matters: a report that lands three weeks after month end describes history you can no longer change, while a near-real-time view lets you catch a problem while it is still fixable. Automating your reporting so that numbers refresh on their own, rather than depending on someone manually updating a spreadsheet each week, is one of the highest-return improvements you can make.
Accessibility matters just as much. Insights should reach decision-makers where they already work, whether that is a dashboard they can open on their phone, a weekly summary in their inbox, or figures surfaced directly inside the systems they use. For many businesses, the most valuable analytics are those embedded into a tool the team already lives in, such as a custom CRM that shows each salesperson their own pipeline health without them ever opening a separate reporting app.
Move from hindsight to foresight
Once descriptive and diagnostic analytics are reliable, the natural next step is looking forward. Predictive analytics uses historical patterns to estimate what is likely to happen, and even simple forecasting can be transformative. Predicting which customers are at risk of leaving lets you intervene before they go. Forecasting demand lets you stock the right inventory rather than tying up cash in the wrong products. Anticipating busy periods lets you roster staff sensibly instead of reacting after the fact.
You do not need a team of data scientists to begin. Many predictive wins come from straightforward statistical techniques applied to clean data, and modern BI tools include forecasting features that are genuinely useful out of the box. The gating factor is almost never the sophistication of the model; it is the quality and completeness of the underlying data. This is why the foundation work pays off repeatedly: every advance in analytics maturity rests on it.
As predictive work grows more ambitious, it often needs custom infrastructure to run models, store predictions, and feed results back into operational systems. That is where analytics shades into bespoke software, and where a considered software integration approach keeps everything connected rather than bolted on.
Govern your data: quality, security, and compliance
Analytics that cannot be trusted is worse than no analytics, because it leads people to make confident decisions on faulty information. Data governance is the set of practices that keeps your data accurate, consistent, secure, and compliant, and it is not optional for any business serious about being data-driven.
Data quality and ownership
Assign clear ownership for key datasets so someone is responsible when a number looks wrong. Establish validation at the point of entry, so bad data is caught before it spreads. Document your metric definitions so there is a single source of truth for what each figure means. These habits are unglamorous but they are the difference between analytics people believe and analytics they quietly ignore.
Security and privacy
Analytics often concentrates sensitive information in one place, which makes it a valuable target and a serious responsibility. Access should follow the principle of least privilege, so people see only the data their role requires. Data should be encrypted, backed up, and protected by the same rigour you apply to any critical system. Our networking and cybersecurity team helps ensure the infrastructure holding your analytics data is properly defended.
Australian businesses also operate under the Privacy Act and the Australian Privacy Principles, which govern how personal information is collected, stored, and used. Analytics projects must respect these obligations, particularly when combining customer data from multiple sources. Building compliance in from the start is far easier than retrofitting it after a regulator or a customer asks hard questions.
Common data analytics mistakes to avoid
Most analytics initiatives that disappoint fail for a small number of recurring reasons. Recognising them early saves a great deal of wasted effort:
- Tool-first thinking. Buying a platform before defining the questions it should answer, then wondering why nobody uses it.
- Ignoring data quality. Building beautiful dashboards on top of dirty, inconsistent data, so the outputs are confidently wrong.
- Vanity metrics. Tracking numbers that look impressive but change no decision, while the metrics that matter go unmeasured.
- Dashboard overload. Cramming every possible chart onto one screen until the signal drowns in noise.
- Analysis without action. Producing insights that are read, nodded at, and never acted upon because no owner or process turns them into change.
- One-off projects. Treating analytics as a report you commission once, rather than a capability you build and maintain.
Almost every one of these traces back to the same root: focusing on outputs and technology instead of decisions and data quality. Keep the decision at the centre and most of these mistakes never take hold.
Build a data-driven culture, not just a data team
Tools and pipelines are only half the story. The organisations that get the most from analytics are the ones where checking the numbers is simply how decisions get made, from the leadership team to the front line. This is a cultural shift as much as a technical one, and it rarely happens by accident.
It starts at the top, with leaders who ask "what does the data say?" before committing to a course of action, and who are willing to change their minds when the evidence disagrees with their instinct. It spreads when people at every level have access to relevant, understandable data and feel confident using it. And it sticks when analytics is woven into routine, such as a weekly meeting that opens with the key numbers, rather than being something people consult only when a problem has already blown up.
Practical enablers help enormously. Reliable IT that keeps the tools running, sensible training so people can read a dashboard, and responsive support when something breaks all remove friction. Steady business IT support is the quiet infrastructure that lets a data culture take root and stay there.
A recommended path to get started
If all of this feels like a lot, the good news is that you do not have to do it all at once. A sensible, staged approach delivers value quickly while building toward something more capable:
- Pick one important decision that is currently made on gut feel, and commit to informing it with data.
- Identify the data that decision needs, and where it currently lives across your systems.
- Get that data clean and connected, even if it is just one pipeline into one simple store to begin with.
- Build a focused dashboard or report that answers the question clearly, and put it in front of the person who makes the decision.
- Use it, refine it, and only then expand to the next decision, letting each success fund and justify the next step.
This decision-by-decision approach keeps analytics grounded in real value, avoids the trap of a giant project that never ships, and steadily builds both the technical foundation and the cultural habit at the same time.
Bringing it together
Data analytics done well is not about having the most charts, the fanciest tools, or a room full of data scientists. It is about asking the right questions, building a foundation of clean and connected data you can trust, presenting answers clearly to the people who make decisions, and turning those answers into action. Get those fundamentals right and even modest analytics will outperform a lavish setup that nobody trusts or uses.
For Sydney and Australian businesses ready to stop guessing and start deciding with evidence, the path runs through solid data foundations, the right tools for your scale, and a culture that actually uses what it measures. If you would like help building any part of that, from integrations and databases to dashboards and custom analytics, our team at NexusByte and our data management services are here to help you turn your data into a genuine advantage.